Ever wondered how the trends and the graphs on different companies are accurate on the stock market and wonder how it shows the exact patterns? Yes, it is due to the data visualization. Moreover, the growing number of internet revolutions tend to rapidly generate billions of data within a minute. With all these chunks of data how to analyze and understand the complex trends and patterns? It can be only done through data visualization. According to Countants, 2.5 quintillion bytes of data are being generated each day globally. Data visualization allows data to be observed in visually interactive ways such as patterns, comparisons, graphics, etc. So the ability to work with data is not just a bonus skill, but an essential one, in fact, it is the highest ROI skill in current times.
Data visualization is indispensable for the going business these days. It is a skill that can be learned for great pay even for entry-level employers. Called as Data viz in the market, it can be self-taught through the right guidance. Yes, let us do something which will create a safe haven for our future. In this article, I have curated the best online courses which provide great instructions on improving the skill which will land us a high paying successful career in this exploding business.
Table of Contents
1. Data Visualization with Tableau Certification by Coursera
Offered by the University of California, this course is a comprehensive data visualization course that is accessible for free. UC Davis, one of the nation’s top-ranked research universities, is a global leader of education institutions.
If you complete this course you can Examine, navigate, and learn to use the various features of Tableau. The duration of the course takes approximately 6months to complete. It is a beginner-level course that will eventually help you to generate powerful reports and dashboards that will help people make decisions and take action based on their business data.
Apply Now
2. Data Visualization with Python by Coursera
The course’s credibility is so high because the course is instructed by IBM. The technology innovator, IBM is a global leader in business. Today 47 of the Fortune 50 Companies rely on the IBM Cloud to run their business.
The course is a 20hour self-paced program which is instructed by Alex Aklson, Ph.D., who is a data scientist in the Digital Business Group at IBM Canada. You can learn this course using several data visualization libraries in Python, namely Matplotlib, Seaborn, and Folium.
Apply Now
3. Data Visualization and Communication with Tableau by Coursera
If you want to learn how to become a master at communicating business-relevant implications of data analyses, this is the right course for you. This course will take approximately 25 hours to complete.
The highlight of the course is it is offered by Duke University, one of the top colleges having campuses all around the world. The course is designed and taught by Daniel Egger who is an Executive in Residence from the University. This course is highly recommended for a great understanding of Data Visualization.
Apply Now
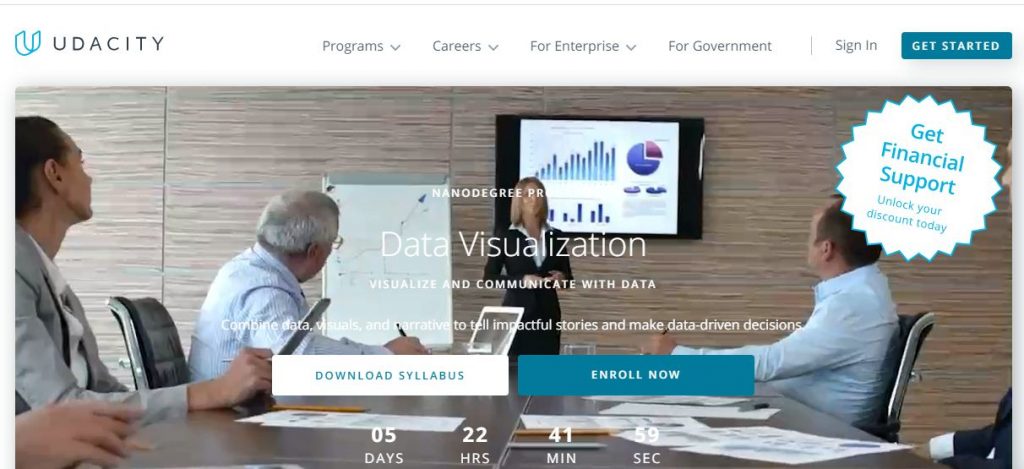
4. Udacity Data Visualization Nanodegree Certification by Udacity
This special course is offered by Udacity, one of the top online education platforms. This course primarily focuses on combining data, visuals, and narrative to tell impactful stories and make data-driven decisions.
The estimated time to complete the course is 4months if there is a dedication of 10 hours per week. There is a requirement of having basic details of data analysis to go forward with this particular course. Build on your data or business background to drive data-driven recommendations after completing this course.
Apply Now
5. Data Visualization with Advanced Excel by Coursera
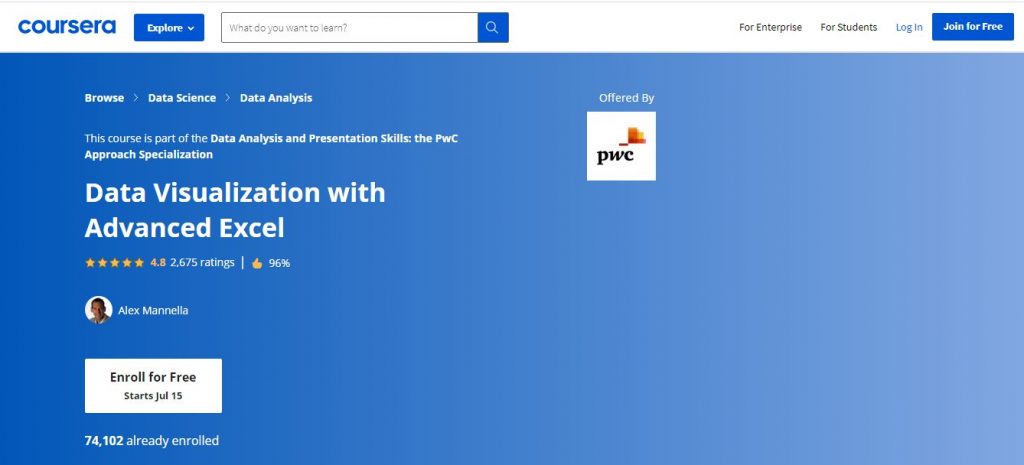
Offering leading professional service networks, PwC has institutions around 157countries across the globe. In this course, you will get hands-on instruction on advanced Excel 2013 functions.
The data visualization and advanced scenario analysis are fully made through Microsoft Excel 2013 version. This course is highly recommended for a step-by-step approach towards learning data visualization. This course is considered to be highly reviewed since it has a whopping 4.8 star on Coursera.
Apply Now
6. Data Visualization by Coursera
The specialty of this course is, it puts emphasis on scalable pattern discovery methods on massive transactional data and discusses pattern evaluation measures. This course is a top-rated course on Data visualization offered by the University of Illinois at Urbana-Champaign is an internationally renowned university offering a wide range of excellent education.
Learn the general concepts of data mining along with basic methodologies and applications in this beginner-level course. This course is highly recommended for its engaging and credible instructing services.
Apply Now

7. Information Visualization Specialization by Coursera
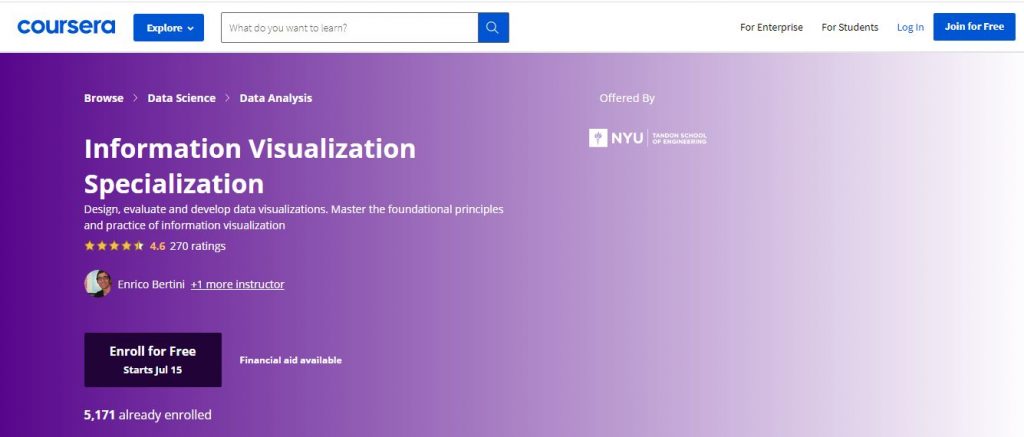
Information Visualization Specialization is a free comprehensive course that helps you to design, evaluate and develop data visualizations. The course is instructed by Enrico Bertini and Christian Felix, renowned professors from the top global university, New York University (NYU).
The course primarily focuses on teaching the students the visual perception and theory of visual encoding to design and evaluate innovative visualization methods. It takes 4 months to complete the novice level course which is available exclusively for free on Coursera.
Apply Now
8. How to Process, Analyse and Visualize Data by MIT
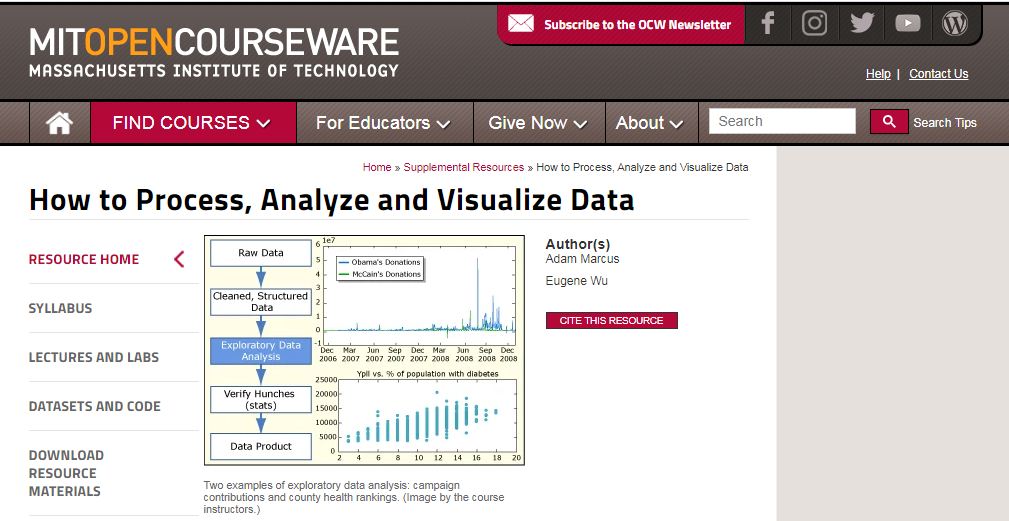
If you want a deeper understanding of the mother concepts like data cleansing, analysis, and visualization, this is the apt course for you. The course is offered by the top Ivy League university, the Massachusetts Institute of Technology. You will learn how to take raw data, extract meaningful information, use statistical tools, and make visualizations.
The disadvantage of this particular course is it is a non-credit course yet the program is extensively informative on data visualization. The course is a 4week term program and it is not a self-paced course. To get more information on this particular course, check the link below.
Apply Now
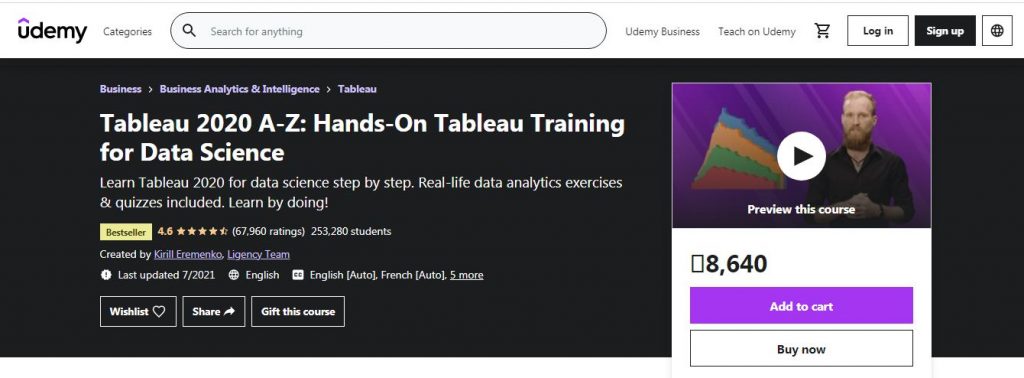
9. Tableau 2020 A-Z: Hands-On Tableau Training For Data Science by Udemy
This course is particularly designed to improve your skill in Tableau 2020. This course is curated in highly engaging modules with Real-life data analytics exercises & quizzes. This challenging course will help you learn to convert Raw Data into Compelling Data Visualizations Using Tableau.
It is a 9hours on-demand course with additional resources of 9 articles to improve our understanding of the subject. The teaching style and the video pacing are highly appreciated for this course. If you are someone who gets bored easily with video lectures, this is the course for you. The course has around 10 sections which comprise 82 lectures.
Apply Now
10. Learning Python for Data Analysis and Visualization by Udemy
The course is not particularly focused on learning data formats using python. Taking this course, you will also learn to use it in JSON, HTML, and MS Excel Worksheets. The course will help you to learn and create data visualizations using matplotlib and the seaborn modules with python.
It is a 21hours course with 110 lectures overall. There is a requirement of having intermediate python skills to make the best out of the course. This course is instructed by Jose Portilla, the Head of Data Science at Pierian Data Inc. he is one of the top instructors of Udemy, the learning platform. This course is highly recommended to learn how to use matplotlib and seaborn libraries to create beautiful data visualization.
Apply Now
